Our scientists in Maple Class worked together this week for a massive investigation. We wanted to find how many of each pet are in our class, and we used some brilliant scientific methods to get our answers!
Step 1: Sorting and Counting with Cubes
We began by using concrete materials. Each child chose a coloured cube to represent their pet at home. By snapping these cubes together, we built "pet towers." This allowed us to see a 3D version of our data before we even picked up a pencil!
Step 2: New Arrivals and Tallying
To test our recording skills, we introduced some "new arrivals" new pets that joined our class for the day. After the children gave them some very creative names, we moved on to tally charts. We practised the "shut the gate" method, where we drew four lines and a fifth one across, to help us count in groups of five.
Step 3: Mapping the Data
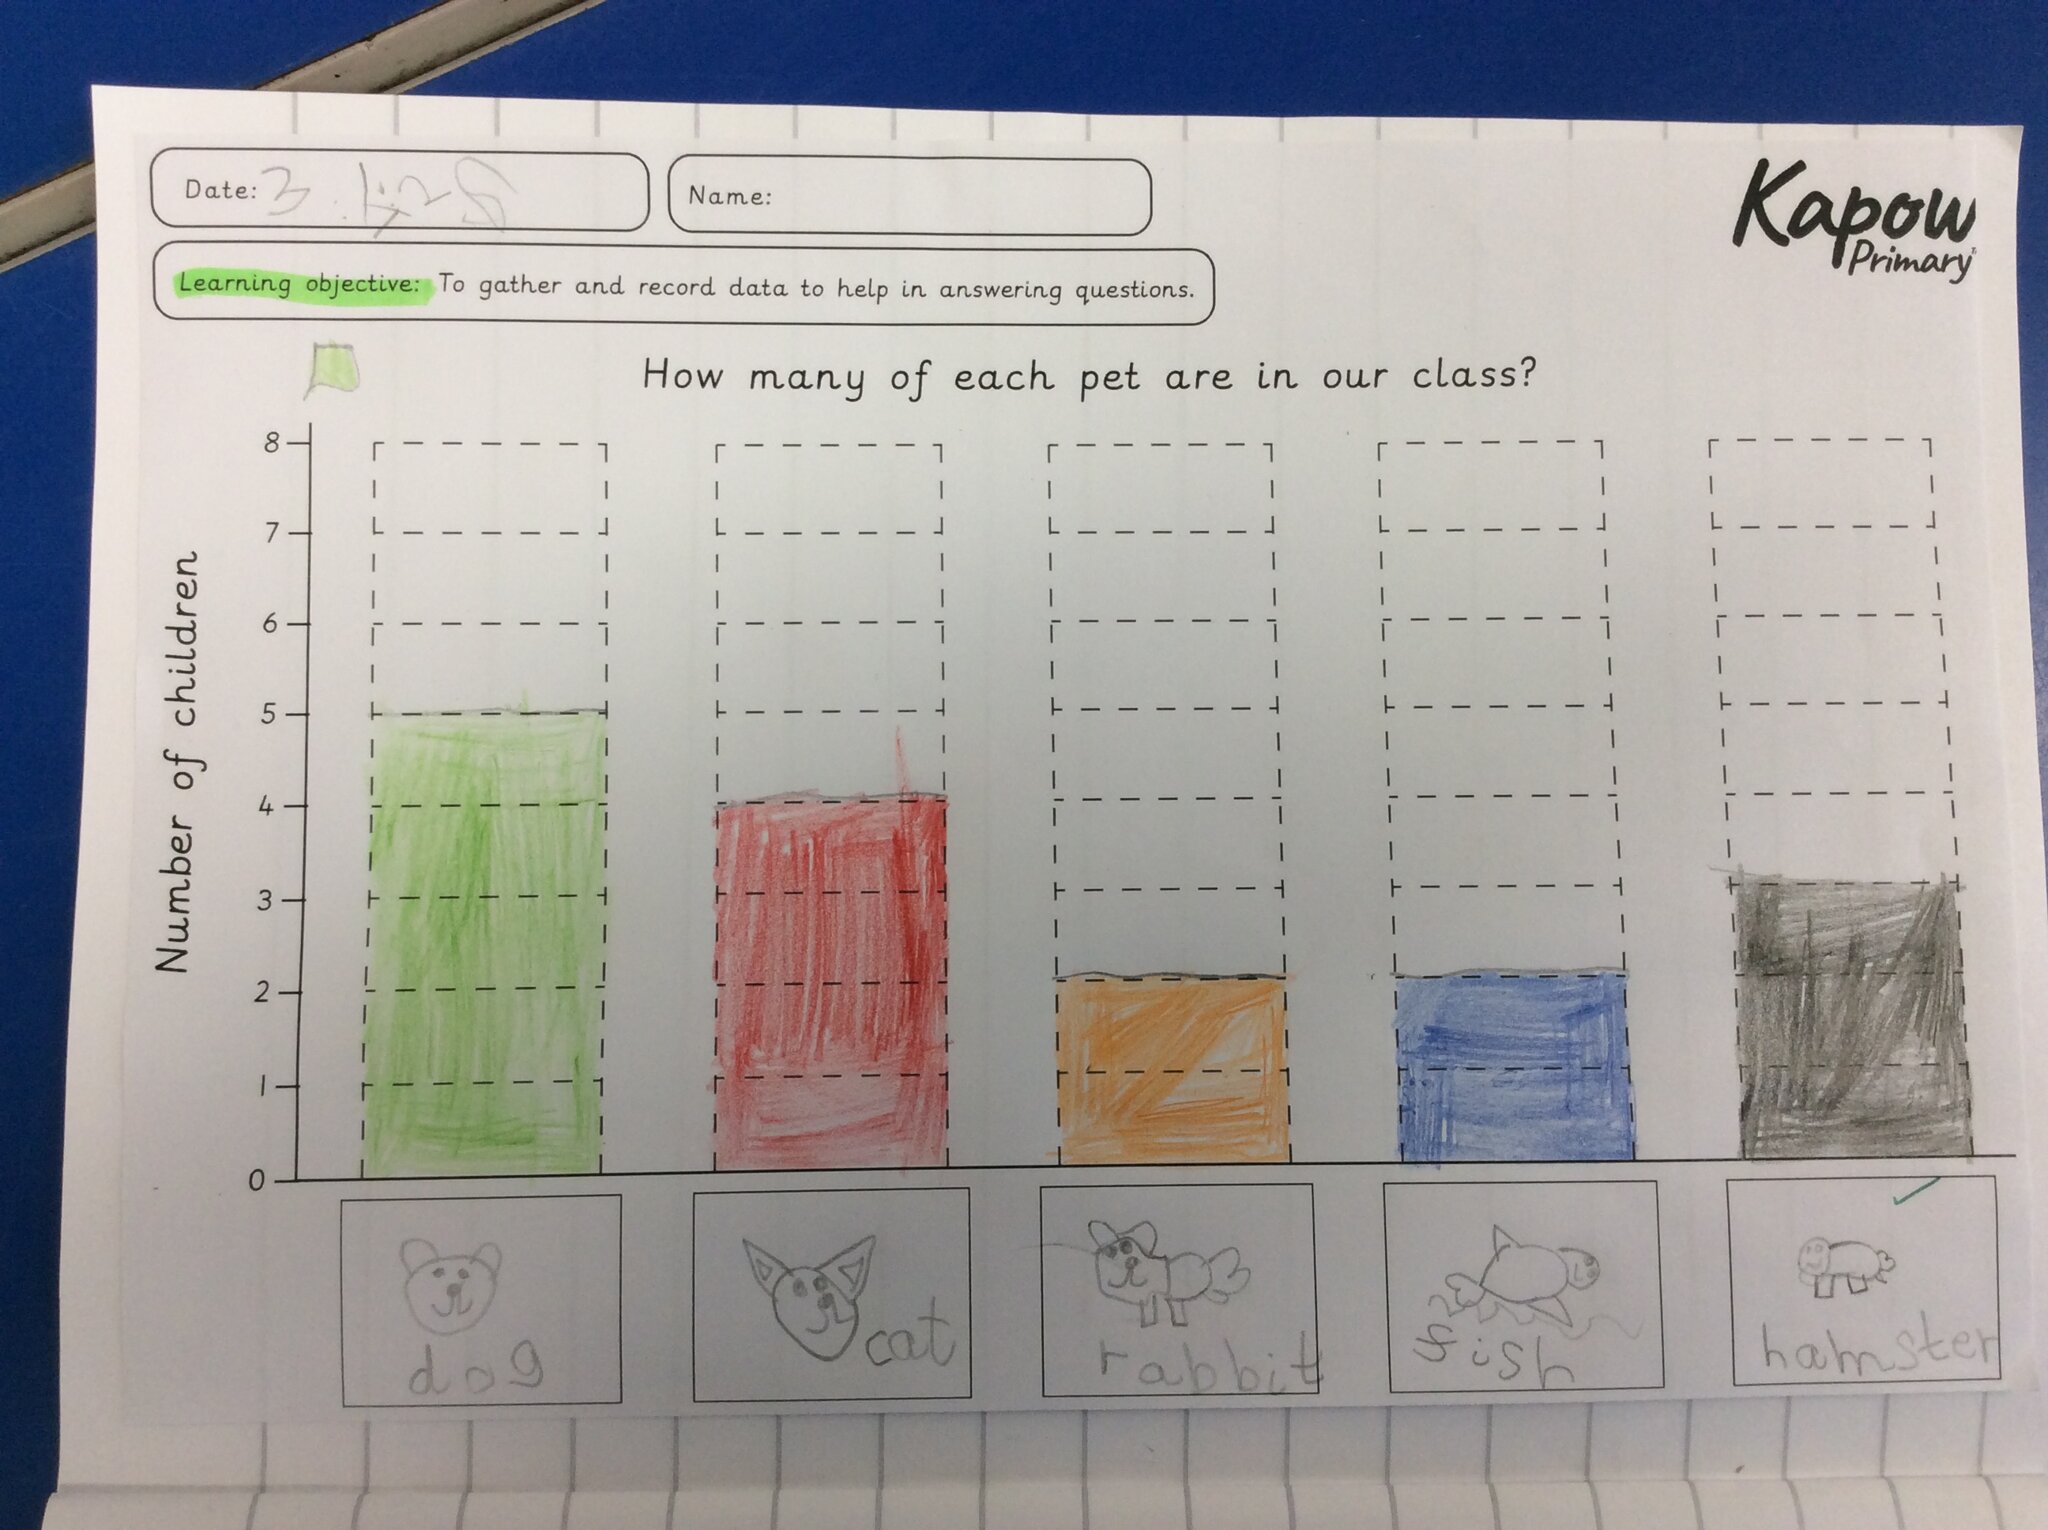
Finally, we turned our tallies into block charts. The children carefully coloured one square for every pet, creating a clear visual map of our findings. This helped us transition from counting individual objects to reading a graph.
Our Scientific Findings:
Once our charts were complete, we sat down to analyse the data like real researchers. Here is what our "Data Detectives" discovered:
- Most Popular: The dogs were the clear winners with the tallest column on our charts!
- Least Popular: The rabbits and fish were our rarest pets, represented by the smallest blocks.
- The Equals: We spotted a tie! Both rabbits and fish received the exact same number of votes.
Why We Learn This Way:
Working scientifically isn't just about lab coats and test tubes; it’s about collecting, recording, and interpreting data. By moving from physical cubes to tally marks and then to block graphs, the children are building a foundation for how to organise information and spot patterns in the world around them.
Ask your scientist: How can you tell which pet is the "most popular" just by looking at the block chart?